Stocks
Status: In trial
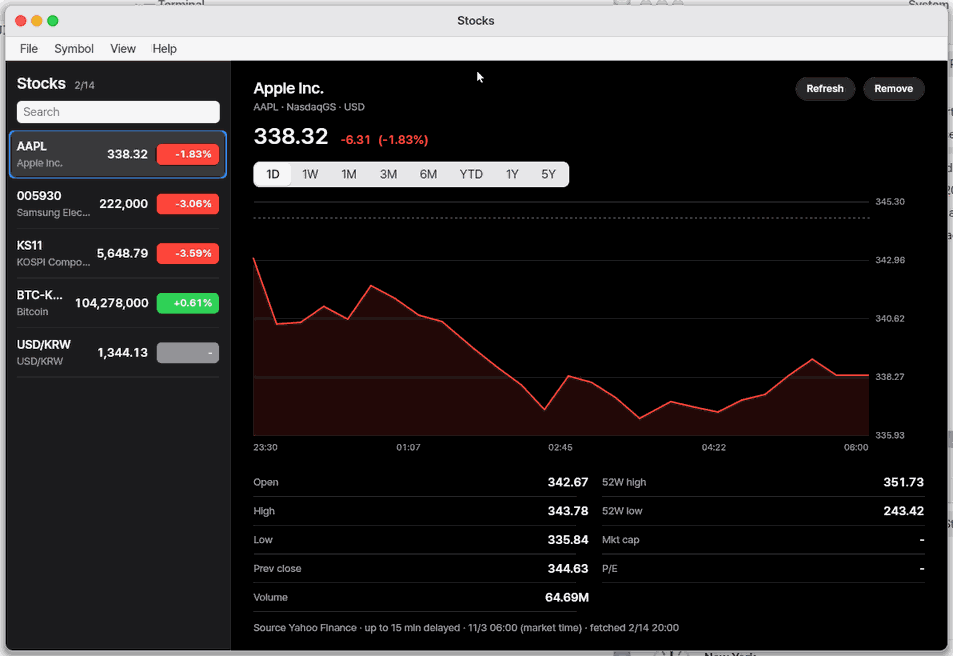
Your watchlist's prices and charts at a glance.
About this app
This app is still being tested (Lab stage). The screen tests and the manual pictures are not finished, and stock quotes come from public pages, so you have to turn them on in the card that asks the first time you open the app. On the phone screen (Mobile) only coins and exchange rates come by default. It is an app for viewing quotes and charts; it does not buy or sell.
Basics
A price chart is like a body-temperature record: a line showing how the value went up and down. "1D" fits one day on the screen and "1Y" fits a year. A moving average (MA) is a line through the average of the last few bars, so you can see the big direction through the ups and downs. Free quotes arrive a few minutes late, so the app writes the source and the delay under every value.
How to use it
- Type a name or code in the search box on the left; candidates appear as you type. "+" adds one to your list.
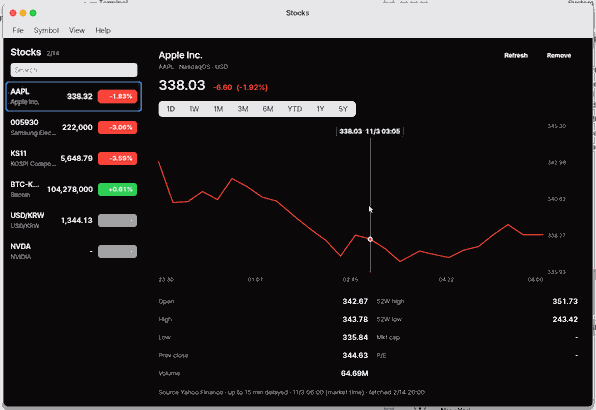
- Pick a symbol in the list and its price, chart and numbers appear on the right.
←→change the range (1D to 5Y). - On the Browse tab look at indices, exchange rates, coins, futures and one page per country, and click a row to see its chart.
- On the Portfolio tab press "+ Add holding" and enter the quantity and your average price to see the total value and gain or loss.
- On the Alerts page set a rule such as "goes above" or "falls below".
Try it yourself
Try it: search "BTC", add it to the list, then change the range and move the pointer over the chart to see the value at that time (coins work without turning anything on).
How it works
- Quotes do not go through a server: this computer asks the sources directly (the coin exchange, the exchange-rate service and, if you turned them on, the public stock pages).
- Every value has its source, how late it is (real time or, for example, 20 minutes late) and the time it was fetched. Offline, the last values stay with that time.
- The gain or loss is quantity times the delayed quote you see; nothing is made up, and a symbol with no quote is left out of the total.
- Price alerts are checked every 15 minutes while NanumOS is running, even with the window closed.
FAQ
Why are the values not real time
Free public quotes are up to 20 minutes late for Korean stocks and up to 15 minutes for the rest. The app writes that under the value, and alerts, news and the portfolio use the same delayed quotes.
Can I buy or sell stocks here
No. There are no orders and no account connection; it is for viewing only. Check any value you will trade on in your broker's app.
Why does the phone show only coins and exchange rates
The stock sources block direct connections from a browser. On the desktop NanumOS it works directly.
At a glance
In one line: An app to see prices and charts of the stocks you follow. It only shows; it does not buy or sell.
The screen
- Search box on the left: type a name or symbol (Samsung, AAPL, gold) to find it
- Tabs under the search box: watch list, Browse, Portfolio
- Chart on the right: the chosen item's chart and numbers
- Period buttons above the chart: 1D, 1W, 1M, 3M, 6M, YTD, 1Y, 5Y
Task 1. Add a stock
- Type a name in the search box
- Press the result line
- Press +
Say: "Open the Stocks app"
Task 2. Put it in your portfolio
- Press the Portfolio tab
- Press + Add stock
- Type the code, amount and average price
- Press Save
Say: "Add 10 Samsung shares at 70,000 to my portfolio"
Task 3. Set a price alert
- Press the Alerts page above the chart
- Choose goes above
- Type the price
- Press Add alert
Say: "Tell me when Tesla goes above 300"
Try this
1. Add a symbol
- Type a name or a symbol (Samsung, AAPL, Bitcoin, gold, oil) in the search box at the top left. The app searches by itself 0.3 seconds after you stop typing (stocks, ETFs, indices, futures, currencies and coins).
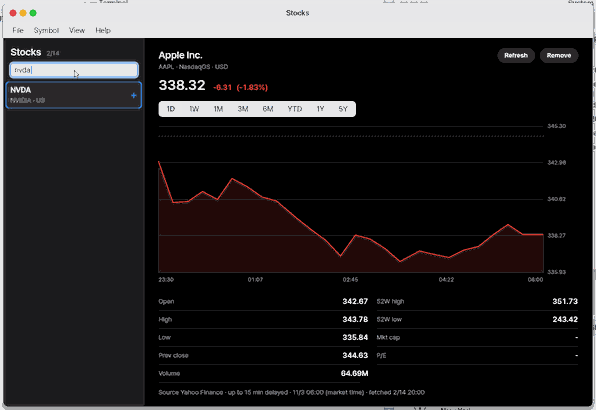
- Click a line and its chart and numbers show on the right first (it is not in your list yet). Click the + at the end of the line, or the "Add to list" button, and it joins the bottom of your watchlist. Each line has a badge — Stock, ETF, Index, Futures, FX, Crypto — so you know what it is.
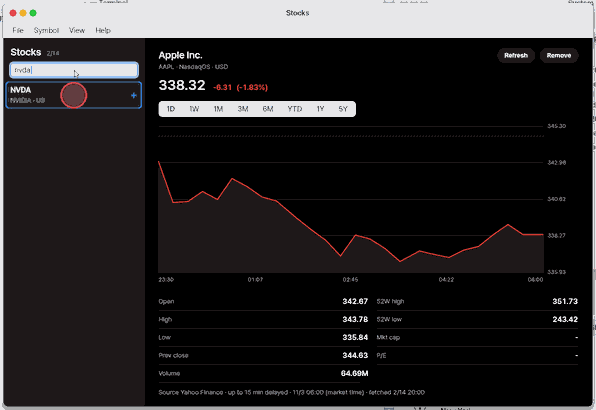
Things that are not companies are found at once: "gold", "oil", "crude", "bitcoin", "USD", "KOSPI", "Nasdaq", "VIX" (and the Korean words for them). Enter asks again right away for what you have typed.
2. Change the range
- Click one of 1D, 1W, 1M, 3M, 6M, YTD, 1Y, 5Y above the chart.
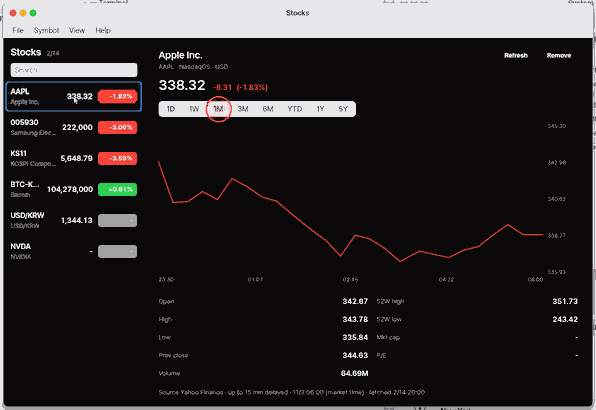
3. Read a point of the chart
- Rest the pointer on the chart (on a phone, touch it): the value and time of that point show above it.
Shortcuts
| Key | What it does |
|---|---|
Ctrl+F | Go to the search box |
Ctrl+R | Refresh |
F5 | Refresh |
Ctrl+, | Stocks settings |
Ctrl+W | Close |
↑ ↓ | Previous or next symbol |
← → | Previous or next range |
Delete | Remove the selected symbol from the watchlist |
Settings
In the Settings app choose Apps, then Stocks (inside the app: Ctrl+,).
| Setting | Choices |
|---|---|
| Colours | Automatic (by language), Up red, down blue (Korea), Up green, down red |
| Refresh | Every minute, Every 5 minutes, Every 15 minutes, Only when I ask |
| Use Yahoo and Naver (personal use) | On, Off |
This computer asks the sources itself; nothing goes through our servers. Coins (Upbit) and exchange rates (ExchangeRate-API) are always fetched. Stock and index prices come from the public pages of Yahoo Finance and Naver Finance, so they are fetched only after you press Use them on the card the first open shows, or turn this setting on (for your own viewing, up to 20 minutes late). Off means nothing is sent to those two.
Under every value you see its source, its delay, the market time and when it was fetched. Offline, the last values stay, with their time.
Browse — the market at a glance
- Click the Browse tab under the search box.
- Pick one: Indices · Exchange rates · Coins · Futures (S&P, Nasdaq, Dow, WTI crude, gold, silver, copper, natural gas, grains ...) · KOSPI and KOSDAQ by market cap · US large caps · Top gainers/losers (Korea, US) · By country.
- In By country pick a country (Korea, US, Japan, China, Hong Kong, Taiwan, UK, Germany, France, India, Vietnam): its main indices and about 20 leading stocks, in local currency.
- Click a line to see its chart and numbers on the right, and "Add to list" to keep it. The ‹ at the top (or
Esc) goes back.
Under each value it says live or e.g. 20 min late. Opening the same list again within a minute shows what was already received; after a minute it is fetched again (one request per list).
Portfolio — what you hold and how it is doing
- Click the Portfolio tab under the search box, then + Add holding. Type the symbol (005930, AAPL, BTC), the quantity and your average price (if you had selected a symbol, its code is already filled in); KRW / USD under it is "Auto" until you tap it. Save (or
Enter;Tabmoves between the fields) writes the line. - At the top: the total value, your profit or loss in amount and percent, and today's change. Under it one line says which quotes these are: Delayed quotes · 11/8 14:05 as of · up to 20 min late · source Naver Finance, Yahoo Finance · USD/KRW 1,344.13 (ExchangeRate-API, ...). The values are your quantity times the very same delayed quotes the watchlist shows — nothing is traded and nothing is estimated. A holding with no quote (or a USD holding while no exchange rate has come in) is left out of the total, and the line says how many.
- The list at the left has one line per holding (name, quantity, value, profit pill). Click one to see its details; Edit changes quantity or price (adding the same symbol again is an edit), Remove takes it out. KRW total / USD total switches the currency the totals are shown in (it uses the USD/KRW rate from the list).
Chart tools
- Under the range buttons: MA5 · MA20 · MA60 · MA120 switch moving averages on (the average of the last 5 / 20 / 60 / 120 bars shown — minutes in 1D, days in 1M–1Y, weeks in 5Y; a line needs that many bars, so MA120 shows on 1Y and 5Y) and Volume shows a bar for each bar's traded volume under the price. Your choice is remembered.
- Rest the pointer on the chart: the box shows price and time, and under it the volume and the values of the averages that are on. Volume is only drawn where the source gives it (not for exchange rates and some indices).
News
- Pick the News page above the chart: up to 12 recent headlines for the symbol, newest first, from Google News (the same RSS feed the News app uses, searched by the company name) and, for non-Korean symbols with Yahoo switched on, Yahoo Finance's RSS. Click a headline: the article opens in the Browser. Only the headline, the outlet and its age are shown here. Naver's news pages are not used.
Company
- The Company page shows what the sources give: exchange, sector and industry (US, from Yahoo), market cap, P/E, EPS, P/B, dividend yield and dividend per share and the 52-week range (Korea, from Naver), and a description when the source has one. A field the source does not give is not shown — nothing is filled in. For US stocks market cap, P/E and dividend are not shown: Yahoo only gives them to a logged-in browser, which this app does not pretend to be.
Price alerts
- Pick the Alerts page, choose Above, Below or ± % today, type the value and Add alert: "tell me when Tesla is above 300", "when Samsung moves more than 5% today".
- An alert is checked whenever quotes refresh (Ctrl+R or the refresh setting), and every 15 minutes while NanumOS is running even if the Stocks window is closed. It shows as a NanumOS notification ("Stocks alert · Tesla — 300.50 USD · at/above 300 · delayed quote 14:05"). It speaks once when the price crosses; it speaks again only after the price has crossed back. An alert that is already true when you make it stays quiet until then.
- Honest limits: the prices are delayed (up to 20 min for Korean stocks, 15 for US), so alerts are too; a computer that is off, offline, or with Yahoo/Naver switched off cannot check. Coins (Upbit) and exchange rates work without those switches.
Ask Zeus
- "Put 10 Samsung Electronics shares at an average of 70,000 in my portfolio" and "tell me when Tesla goes above 300" work in the Zeus window: they write your own portfolio / alerts at once (no approval card — it is your own data), shown as a step; you see and delete them in Stocks. Zeus never trades.
How it works
Search asks three places in turn: first a name table on this computer (words like gold → gold futures and a gold ETF, oil → WTI crude futures, and well-known company names), then Naver Finance (Korean company names), then Yahoo Finance (stocks, ETFs, indices, futures, currencies and coins worldwide). A symbol shows once. Each Browse list arrives in a single request: KOSPI/KOSDAQ rankings from Naver Finance; US rankings, futures, rates, indices and the country lists from Yahoo Finance; coins from Upbit. A futures contract month (e.g. "Dec 26") shows in the name once you open it. Yahoo does not state its delay in the answers today, so Yahoo values carry the known exchange rule (Korea 20 minutes, others up to 15); Naver and Upbit values carry what the source says (live). KOSPI 200 futures are not offered by Yahoo or Naver, so they are not here.
What it cannot do
- No trading and no brokerage account. It only shows prices.
- No real-time data: every price is a free, delayed one, and says so. Alerts, news and the portfolio use those same delayed quotes.
- On a phone (NanumOS Mobile) only coins and exchange rates come in by default, with no Browse tab: Yahoo and Naver do not let a browser ask them directly. On the desktop NanumOS it just works.
- What you get: the same as the desktop — indices, stocks, futures, search as you type, the Browse tab, per-country lists and charts, with the same "15 min delayed" labels.
- Prices are only as right as their source. Check a price you trade on in your broker's app.
NanumOS 0.1.8349 · 2026-11-16