System
Status: Ready
What this computer is and how it is doing, in one window.
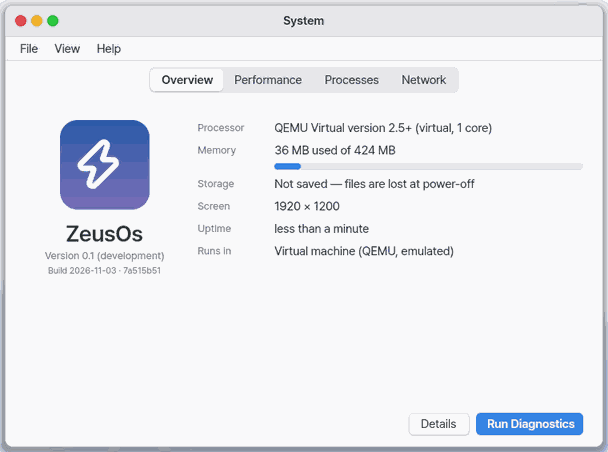
In a wide window Overview shows the NanumOS mark, the version and this computer in one line in the middle, and under them four cards across the width — Storage (bars), Memory (percent and a bar), Screen (resolution and scale) and Software (version, uptime, where it runs, processor).
About this app
An app that shows in one window what this computer is and how it is doing right now.
Basics
Think of a car dashboard: the speedometer and fuel gauge tell you the state at a glance. A computer has a processor (the head that works), memory (the workbench) and storage (the drawers). When the workbench is full or the head never rests, things slow down. This app shows those three and the network connection in words, bars and graphs.
How to use it
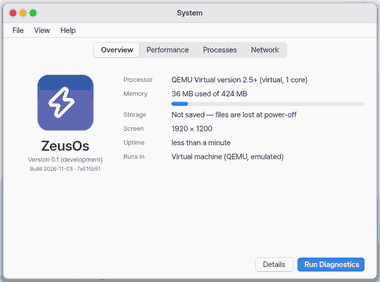
- The window opens on Overview: version, processor, memory, storage, uptime and where it runs.
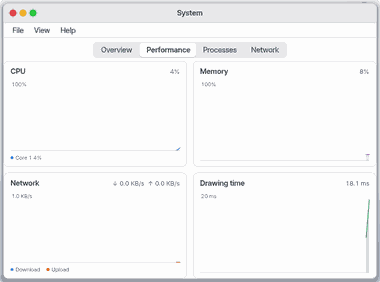
Ctrl+2opens Performance: graphs of processor, memory, network and frame-drawing time.Ctrl+3opens Processes: running programs and the resources they use. Pick one and pressDeleteto end it (it asks first).Ctrl+4opens Network: connected or not, the address and how much went in and out.F5refreshes, andCtrl+Dshows or hides the developer numbers.
Try it yourself
Try it: press Ctrl+2 to open Performance, then open another app and watch whether the graphs move.
How it works
- When it is hidden or minimised it draws nothing, so it does not keep the computer busy.
- The machine facts (version, processor, memory and so on) are shown as the system reports them.
- When a use in the resource table passes 70% of its limit, one system notification appears.
- "Run diagnostics" runs the Zeus check in the background and marks each row healthy, caution, fault or ?
Technical details
The four tabs are Overview, Performance, Processes and Network. The values come from the platform layer (gui_platform.h machine, src/gui/sysinfo.c, and tools/weblite/shim_system.c on Mobile). "End..." on the Processes tab runs kill PID or vmx stop NAME after you confirm. Settings (Settings > Apps > System or Ctrl+,): graph interval 1, 2 or 5 seconds, developer numbers shown from the start. Version 1.3.0.
FAQ
Where do I see battery and temperature
They are not in this window. The battery is in the bar at the top of the screen.
I do not see "Check for updates"
It shows only on a computer set up from a USB stick or disk. It reads the update slot on the USB, not the internet, and shows the current and waiting versions.
Do I lose work if I end a process
It asks first. Unsaved work in the program you end can be lost.
At a glance
In one line: See in one window what this computer is and how busy it is now.
The screen
- Four panes on top: Overview, Performance, Processes, Network
- Cards in Overview: storage, memory, display, software
- Performance pane: CPU, memory and network as graphs
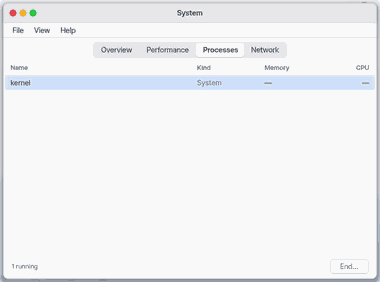
- Processes pane: running programs and how much they use
Task 1. Learn about this computer
- Open the System window
- Read the Overview pane
Say: "Open the System app"
Task 2. See how busy it is
- Press
Ctrl+2 - Look at the graphs
Say: "What does the System app show?"
Task 3. See running programs
- Press
Ctrl+3 - Choose one program
- Press
Deleteto end it
Say: "Bring the System app to the front"
Try this
1. Know this computer
- The window opens on Overview: version, processor, memory, storage, uptime and where it runs, in words.
2. See how busy it is
- Press
Ctrl+2for Performance: CPU, memory, network and drawing time as graphs.
3. See the running programs
- Press
Ctrl+3for Processes: the running programs and their computing time. The resource table below shows usage and limits for jobs, pipes, temporary files, saved file names, open handles and TCP connections. A System notification appears when one crosses 70%. Pick a program and pressDeleteto end it.
Shortcuts
Ctrl+1Overview,Ctrl+2Performance,Ctrl+3Processes,Ctrl+4Network;Ctrl+TabandShift+Ctrl+Tabwalk the tabsCtrl+Ddeveloper numbers on or off,F5RefreshCtrl+,Settings,Ctrl+WClose
Settings
Settings › Apps › System (or Ctrl+,): the graph interval (1, 2 or 5 s), developer numbers shown from the start.
- Check for Update shows only when NanumOS started from a USB stick or disk install; it shows the running and pending release of the update partition.
- Run Diagnostics runs Zeus's check in the background and marks each row healthy, warning, problem or ? It changes nothing.
What it cannot do
- No battery or temperature here (the battery is in the top bar).
- Check for Update does not look online; it reads the USB update partition.
- x86 uses one core.
NanumOS 0.1.8349 · 2026-11-16