Tasks
Status: Ready
See what runs and how busy the computer is, and find out why it is slow.
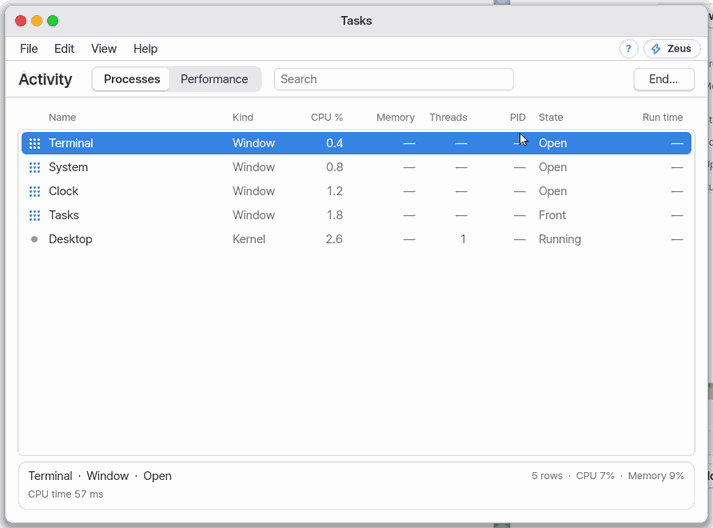
About this app
An app that shows the windows and programs running now and how busy the computer is, and helps find out why it is slow.
Basics
A slow computer is like a supermarket with a long checkout queue: look at who is holding up the line and you see the cause. Each program running on the computer is called a process, and this app lists, per process, how much of the processor (the head that works) and memory (the workbench) it uses. Sort so the longest-holding row is at the top and the culprit is easy to spot.
How to use it
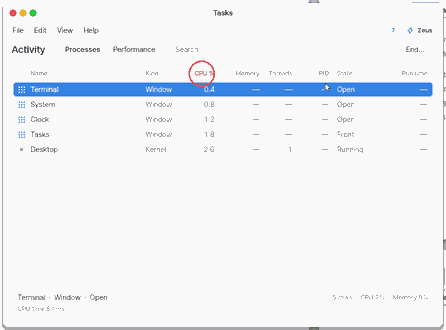
- Click a column heading on the Processes page to sort by it. Click "CPU %" and the busy rows come to the top.
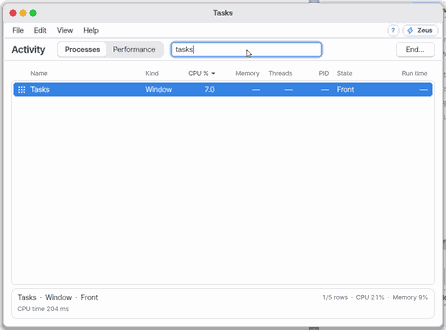
- Type in the search box at the top (
Ctrl+F) and only rows whose name, kind or PID match stay. - On Performance (
Ctrl+2) pick processor, memory, disk or network for a big graph, and choose 1, 5 or 15 minutes. - Pick a row and press "End..." (
Del); it asks first. - "Why is it slow?" (
Ctrl+Y) tells you the cause right now, and History (Ctrl+3) shows what happened before.
Try it yourself
Try it: click the "CPU %" heading to bring the busiest row to the top, then click that row and read the card below the table.
How it works
- "CPU %" is a share of the whole computer; a window's figure is the time that app spent drawing and working inside the desktop.
- History lives only in memory while NanumOS is on and is not saved to disk.
- The visible columns, their order, the refresh interval, apps-only and tree view are remembered.
FAQ
Do I lose work if I end a program
A window closes at once, and a program asks first. "End" gives it time to clean up; "Force end" stops it right away and unsaved work is lost.
Why do some values show "—"
For example a process's user, open files, temperature and swap are left empty.
Is History saved
It is not saved to disk; it exists in memory only while NanumOS is on. To keep it, use "Export report..." to make a text file.
At a glance
In one line: See the windows and programs running now, and find out why the computer is slow.
The screen
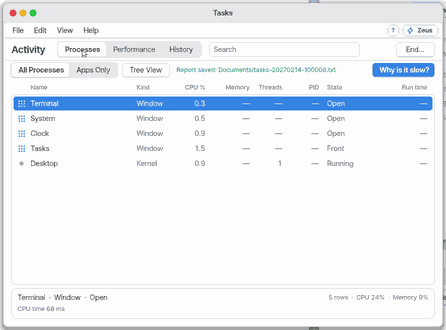
- Top Processes, Performance and History: switch what you look at
- Search box at the top: keeps only lines with your text
- Why is it slow? button: explains the cause in plain words
- End... button: ends the chosen line
Task 1. Ask why it is slow
- Press Why is it slow?
- Read the card
Say: "What is the Tasks app for?"
Task 2. Find the busy program
- Open the Processes side
- Press the CPU % header
- Look at the top line
Say: "Open the task manager"
Task 3. End a program
- Choose a line on the Processes side
- Press End...
- Press End in the box that asks
Say: "Bring the Tasks app to the front"
Try this
1. Find and sort processes
- Click a heading of the table on the Processes page to sort by it. Click "CPU %" and what keeps the computer busy comes first; click again to reverse, once more for the plain order.
- Type in the search field above: only rows whose name, kind or PID contain it stay. Esc clears it. Pick a row and the card under the table shows its parent PID, threads, memory, CPU time and run time.
2. Look at performance
- Click "Performance" at the top.
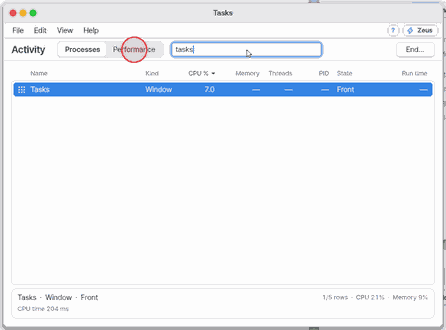
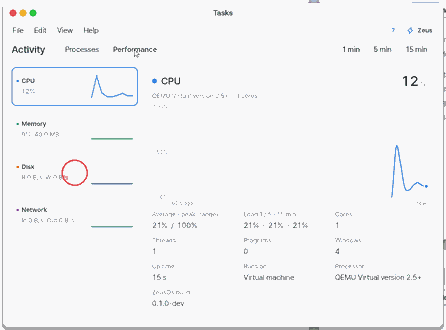
- Pick CPU, Memory, Disk or Network in the list on the left (Battery shows only on a computer that has one) and the big graph and numbers appear on the right. Pick 1, 5 or 15 minutes at the top right; point at the graph to read the value at that time.
3. End a program
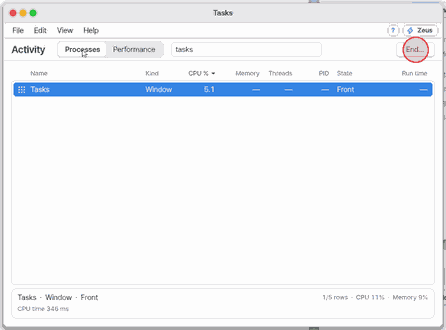
- On the Processes page pick a row and click End. A window ends at once (like Quit in the Dock); a program asks first: Cancel, End (it may clean up) or Force End (stopped at once, unsaved work is lost). "Force End…" in the File menu does the same for a window.
4. Ask "Why is it slow?" and look back
- Click "Why is it slow?" (or press
Ctrl+Y). A card names the biggest cause right now in plain words: an app that held the whole screen, an app using most of the processor, memory that is nearly full, or a busy disk or network. When the cause is an app or a program it has an "End" button for it. The card never offers to end the desktop, a VM or Tasks itself.
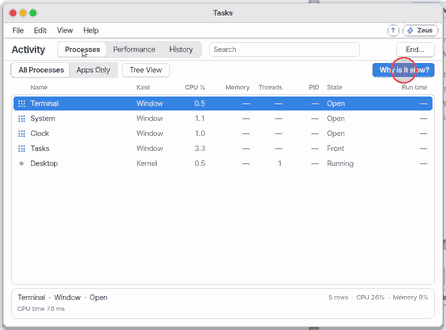
- "Not Responding" in red in the State column means an app held the screen for a second or more (or a program in a window stopped reading the keys for 3 seconds); "Slow" in orange is a hitch of 0.3 to 1 second. It stays for 20 seconds.
- Click "History" to see the last 10 minutes of every app: CPU now, average and peak (and when), the biggest memory and a graph. It is recorded also while this window is closed, so a spike from before you opened Tasks is there, and an app that has ended stays in the list. Below it, "What stopped the screen lately" lists the last stalls.
5. Choose columns, view as tree, keep a report
- Right-click a heading to tick the columns you want (Parent PID and CPU time are extra) and to move that column left or right. View › "Default Columns" brings the usual ones back. The choice is kept.
- "Apps Only" (above the table) lists windows and VMs; "All Processes" lists everything. "Tree View" puts a program under its parent. View › "Update Every 1 / 2 / 5 s" sets how often the table refreshes.
- File › "Export Report…" (
Ctrl+E) saves a text report to Documents: CPU, memory, disk, network, the verdict of "Why is it slow?", the stalls, every process and the 10-minute summary per app.
Shortcuts
| Key | What it does |
|---|---|
Enter | Bring to Front |
Del | End… |
Shift+Del | Force End… |
Ctrl+1 / Ctrl+2 / Ctrl+3 | Processes / Performance / History |
Ctrl+T | Tree View |
Ctrl+Y | Why Is It Slow? |
Ctrl+E | Export Report… |
Ctrl+F | Find |
Up Down | Pick a row (on Performance: a resource) |
Ctrl+W | Close |
Ctrl+C | Copy Row |
F5 | Refresh Now |
F1 | Tasks Help |
Settings
What it cannot do
- Not available: a process's user, open files, CPU clock and temperature, swap, disk response time, GPU, screen FPS, battery time left. Those places are left out or show "—". The full table is docs/apps/tasks.md.
- The per-core graphs appear only where the computer counts each core's idle time (the app on an Apple silicon Mac).
- "Kernel & desktop" in Memory is what is left of the used memory after programs, files and cache.
- The table holds 64 rows. If there are more, the rest are not shown.
- A window's CPU is only the time its app spent drawing and working inside the desktop; programs an app started (News's readpage, ...) are rows of their own.
- "CPU %" is a share of the whole computer (every core). The Linux VM the Browser and the web apps share is one row, "Browser VM", drawing the screen is "Desktop", and neither can be ended (close or minimise the Browser and the VM rests by itself after a minute).
- The History page is kept in memory only while NanumOS runs; it is not saved to disk. The report is a text file, not a graph.
- "Not Responding" can only be named after an app lets go: the desktop is one thread, so an app that never returns freezes every window, this one too. Slow key handlers are not attributed to an app.
- Not available: open files and ports of a process, sampling a process, energy use, disk or network per app, the AI cost per app, a graph in the Dock icon. docs/apps/tasks-vs-activity-monitor.md says why for each.
- Memory pressure is worked out from how full memory is (it is not a kernel counter); NanumOS has no swap and no memory compression, so those lines say None.
NanumOS 0.1.8349 · 2026-11-16